


The Alarm Bells
"We think we have a problem." That's how the conversation with the customer success team started: A polite heads-up about a potential memory leak by the platform team. Little did we know, we were about to embark on a debugging adventure worthy of any great detective novel. Within hours, three of our largest customers were reporting significant performance issues. Clearly, this wasn't just "a problem." It was a full-blown crisis.
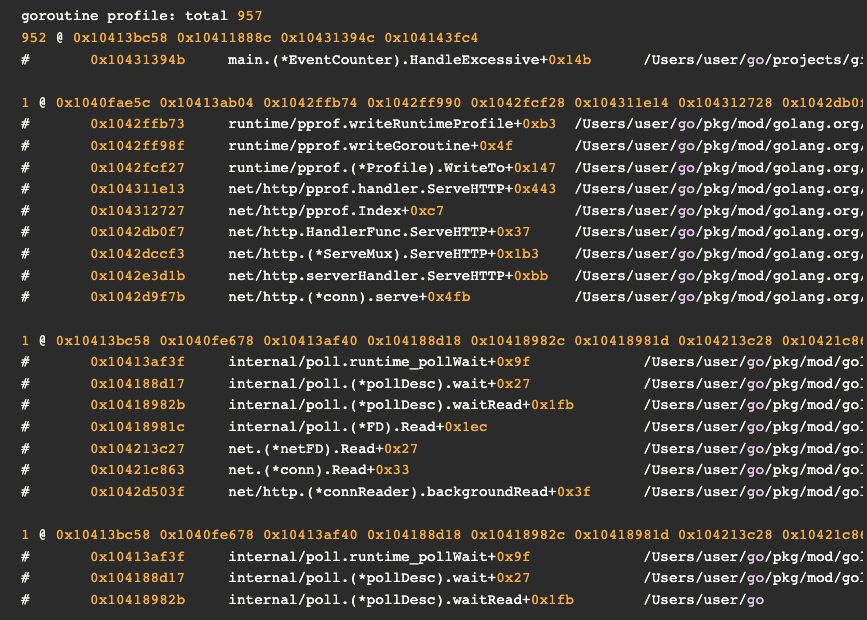
Memory leaks are generally uncommon in garbage-collected languages like Go. When they do occur, they typically result from unintentionally holding onto references in a global slice or, more frequently, from goroutine leaks. Goroutine leaks happen when a system spawns goroutines that hang without terminating, consuming memory both directly through goroutine allocation and indirectly by retaining references to heap-allocated objects. To begin our investigation, we therefore gathered heap and goroutine profiles. By examining the aggregated goroutine data from debug/pprof/goroutine?debug=1 and seeing no accumulation of active goroutines, we were able to quickly eliminate goroutine leaks as a potential cause.
The Three Body Problem
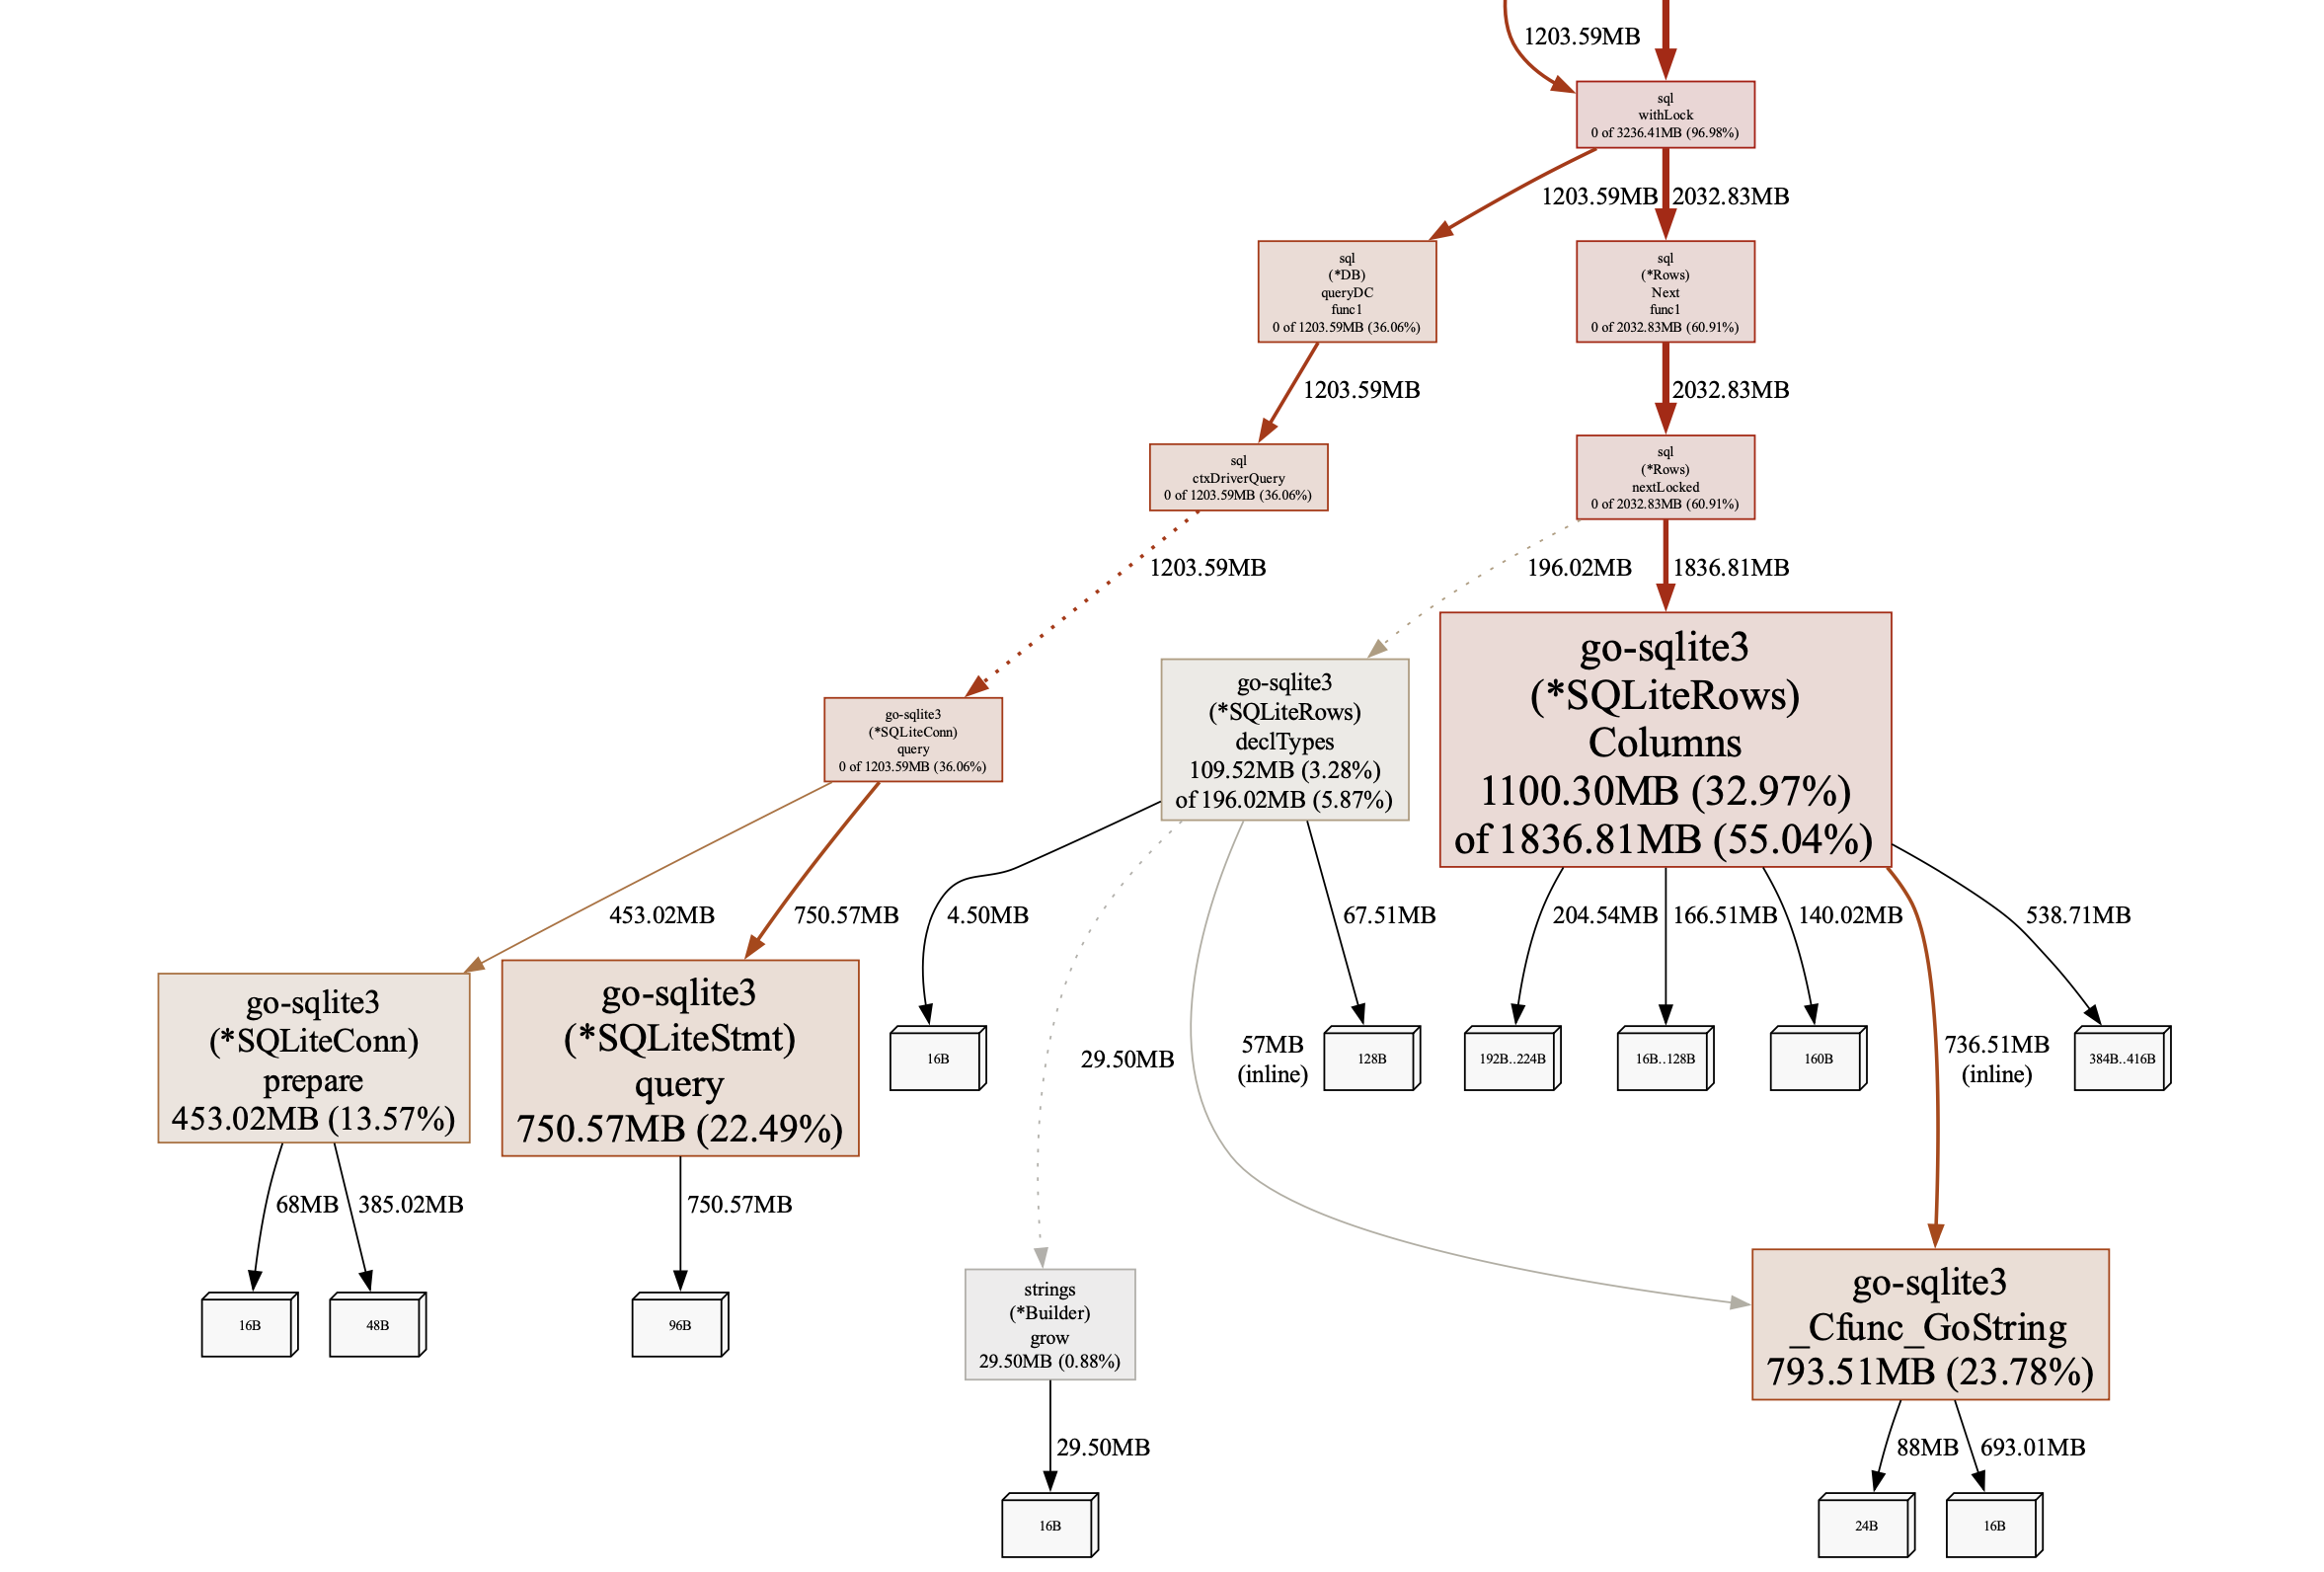
Unfortunately, the heap profiles offered little comfort. We generated a graph of in-use object allocations using go tool pprof -pdf heap.pprof, and the results pointed directly to our SQLite3 driver. The visualization revealed two distinct leak sources: one from a cloud provider service that samples available applications by querying the database, and another from our inventory's database cache management. Notably, both paths led to the same leaked resource within the SQLite3 driver.
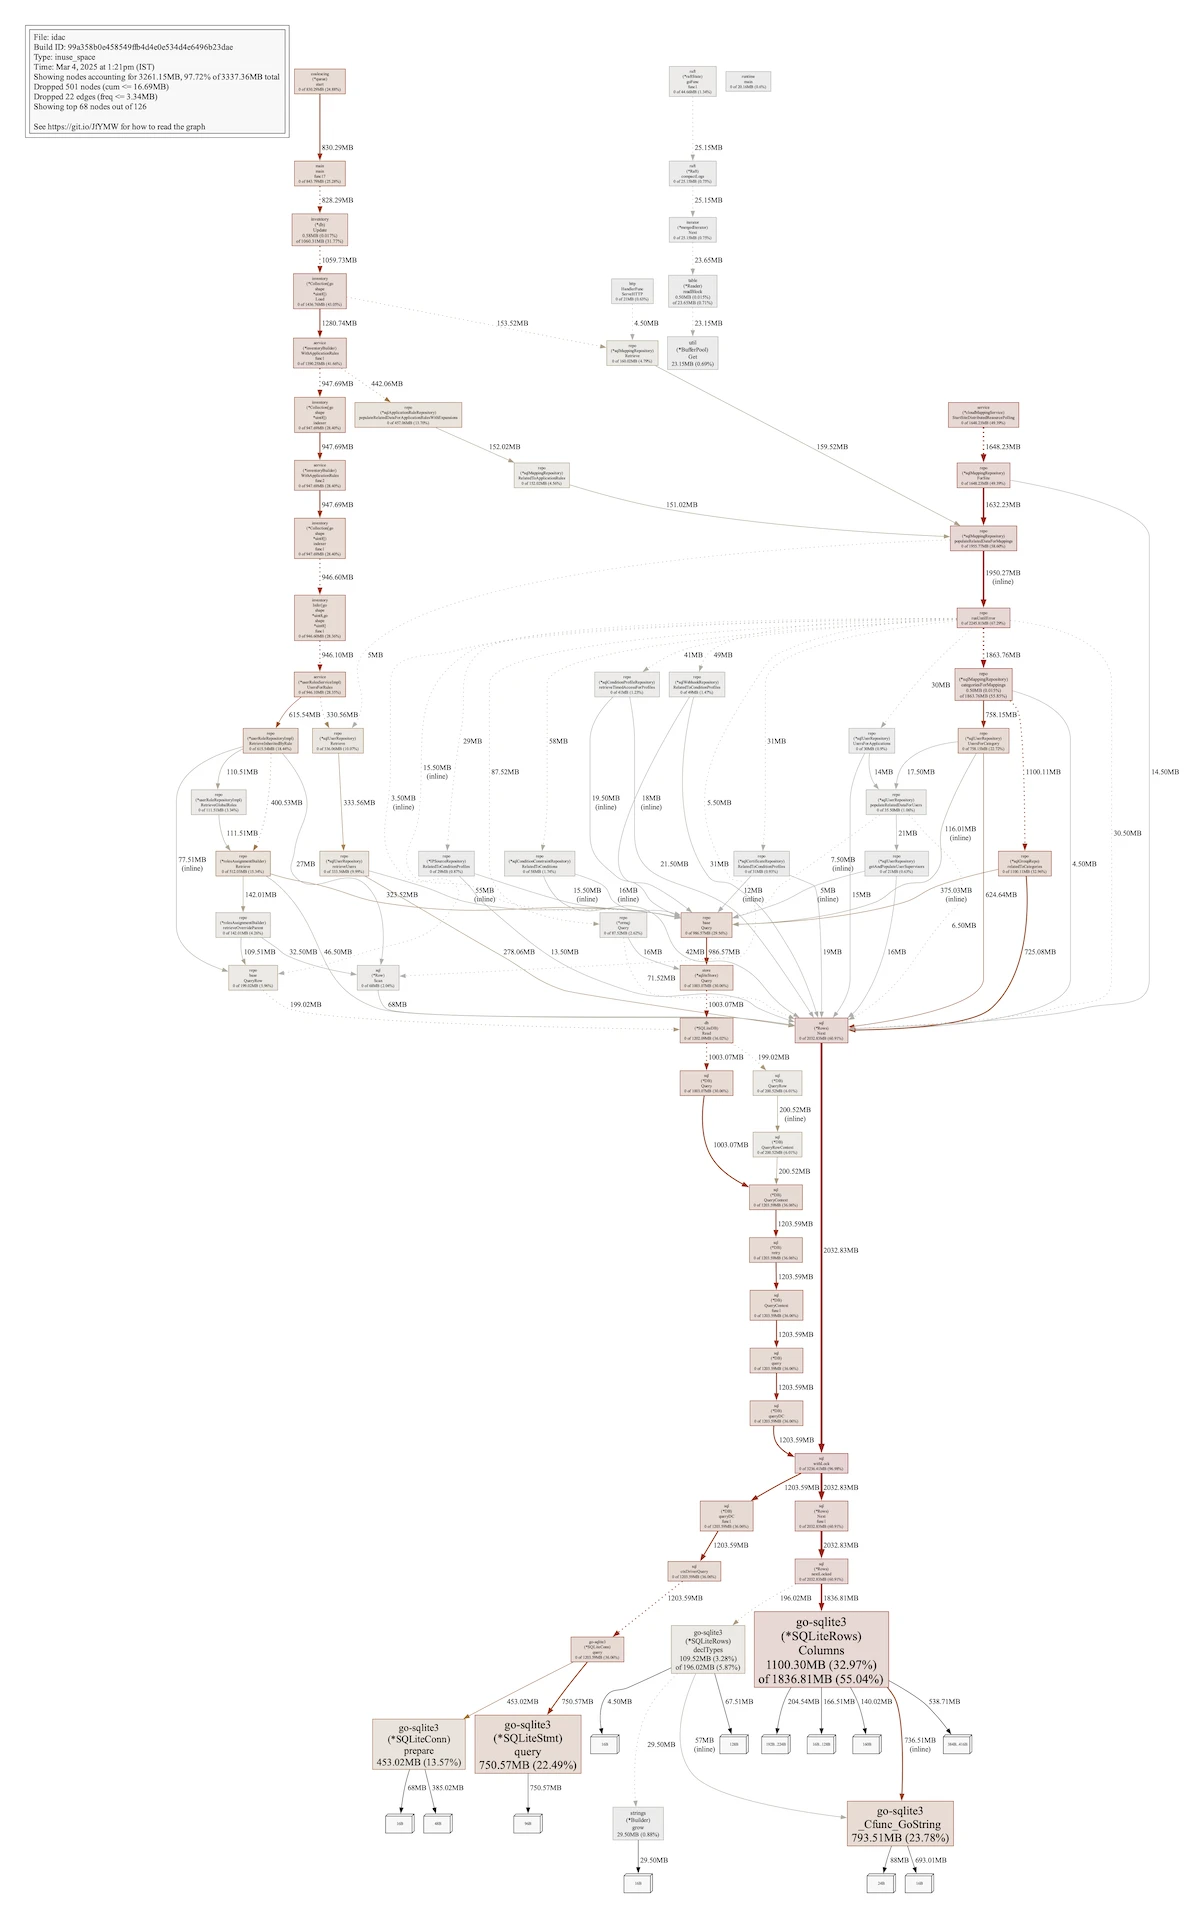
In Go, pinpointing memory leaks is usually a matter of following the heap profile's allocation trails and inspecting the relevant code. The language's inherent memory management minimizes leak possibilities. But this case defied expectations. We observed leaked SqliteRows, SqliteStmt, and SqliteConn objects, with no trace of the referencing code. Given our standard pattern of db.Query, row processing, and return, these objects should have been freed. To confirm it wasn't our code, we simulated a leak with model.Mapping, which predictably leaked linked model.Group and model.User objects. The distinct pattern in the heap profile confirmed the SQLite leak's outlier nature.
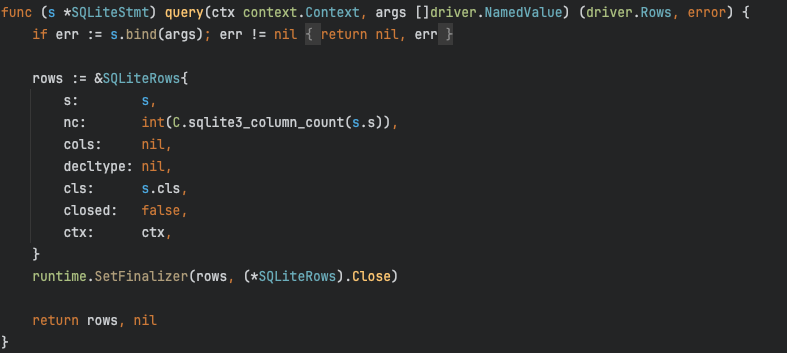
Having narrowed down the leak to the SQLite3 driver surroundings, we next proceeded to examine its source code, focusing on a recent update. We meticulously reviewed our own code and Go's database/sql package, which directly utilizes the driver, and found no improper usage. However, the recent addition of a finalizer to SqliteRows caught our attention. Finalizers are functions run by the Go runtime on an object right before it's garbage collected, but they are known to be error-prone. A significant concern is the creation of circular references among objects pending finalization. Our suspicion centered on the possibility that SqliteConn might point back to SqliteRows, creating such a cycle and hindering garbage collection. Nevertheless, a detailed examination revealed no such circular dependency. We also eliminated CGO leaks as a potential cause, given that Go's memory profiles do not include memory allocated through C code.
Beyond the Dead-End
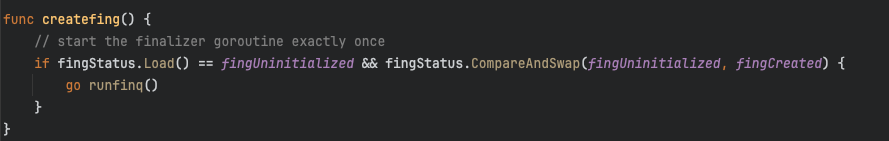
We reached a point where the only remaining suspect was the Go runtime. A runtime bug seemed highly improbable, but we had to explore every avenue. We turned our attention to the finalizer mechanism, which relies on a single goroutine initiated in runtime/mfinal.go, for execution. We hypothesized that a blocked finalizer goroutine could lead to the leak we were observing. We successfully recreated the scenario, clearly demonstrating the leak.
“A single goroutine runs all finalizers for a program, sequentially. If a finalizer must run for a long time, it should do so by starting a new goroutine.”
(Source: SetFinalizer function at runtime/mfinal.go)
We were certain a breakthrough was imminent. "This has to be it!" I remember exclaiming during a late-night debug at our go-to coffee shop. We turned to the customer's goroutine profiles, fully expecting to find runfinq and mfinal.go. But despite its presence in our reproduction environment, it was completely absent in the customer's. It felt like we were back to square one.
With no other immediate clues, we decided to leverage goref, a tool for analyzing heap object references. Similar to the garbage collector's view, goref can map the reference graph, potentially answering our key question: who is holding onto those SqliteRows objects? To use it, we deployed a debug build to our customer, obtained a core dump, and generated the goref profile using grf core exec_file core_file. We then launched the interactive viewer with go tool pprof -http=:5079 ./grf.out, our hopes were high. Nothing.
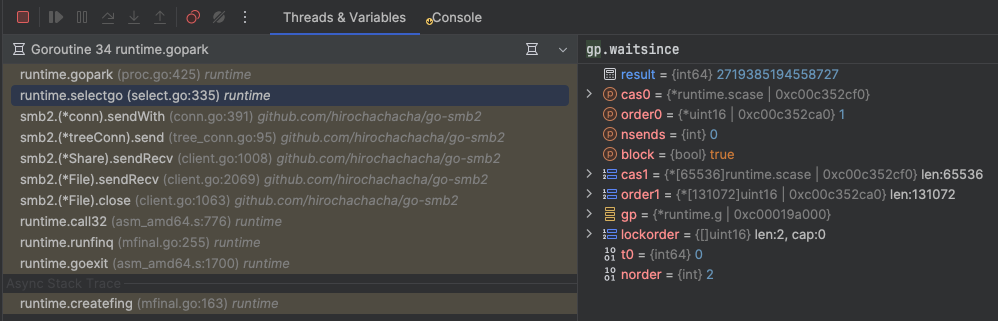
goref showed only 130MB of reachable objects. This indicated that no live objects were referencing our leaked data, yet it remained uncollected. This strongly suggested the issue resided within the Go runtime itself. We then opened the core dump directly in Goland and meticulously examined mfinal.go, which led to its goroutine: Goroutine 34. We examined gp.waitsince, a field recording the nanosecond timestamp of a goroutine's entry into a waiting state. Comparing this with a regularly executing routine allowed us to determine the approximate time our routine was blocked. The truth became apparent: Goroutine 34 had been blocked for an astonishing 197 minutes by go-smb2.
From Bug to Better Go
At last the solution emerged: a blocking bug in go-smb2, a package we relied upon, was the root cause. The problem had two facets. First, go-smb's Close function, which was being used as a finalizer, performed I/O operations that could potentially block for extended periods. Ideally, this should have been executed within a separate goroutine. Second, our application's usage of go-smb introduced a race condition that triggered this blocking behavior. Consequently, the finq goroutine was blocked, leading to the SQLite leaks during our database operations. However, a baffling detail remained: why was mfinal.go missing from the goroutine traces? We discovered a peculiar debugging anomaly: the mfinal.go trace was only absent in debug/pprof/goroutine?debug=2, while it was visible in debug=1. This was counterintuitive, as debug=2 should provide the most detailed traces. It appeared that the first frame was being unexpectedly removed, hiding the mfinal.go source. We quickly reported this bug to the Go team, who fixed it.
We revisited a discussion thread we had initiated on golang-nuts, a Google group I follow, which engages both the broader Go community and Go maintainers. We detailed our research findings and highlighted the significant challenges in diagnosing this issue within the current Go environment. We emphasized the critical point that a single malfunctioning finalizer could lead to the leakage of all objects awaiting finalization across any package. This discussion resulted in the creation of three additional issues:
While the upcoming Go fixes were promising, we needed an immediate solution. We sought a reliable way to detect blocked finalizers without relying on customer environment profiles, which are often obtained too late. To achieve this, we implemented a monitoring loop that generates a disposable object with an associated finalizer. By tracking the execution time of this finalizer, we gained a real-time indication of potential delays or blockages. This data is visualized in our Grafana dashboard and triggers a Bugsnag event, including the full trace, upon detection of a blocked finalizer.
Final Thoughts
We were confronted with a complex memory leak issue, a relatively uncommon occurrence in Go. This presented us with a significant challenge, but also a unique opportunity to expand our knowledge of Go's runtime behavior and debugging techniques.
Our approach was defined by a relentless determination to uncover the root cause. We committed to questioning every assumption and pursuing every lead, even when the path forward seemed unclear or even impossible. This tenacity drove us to dig deeper and explore every possibility, refusing to be deterred by initial setbacks.
This investigation was a testament to the power of teamwork and collaboration. We fostered an environment of shared ideas, mutual support, and collective problem-solving. Every discovery and every step forward was a result of our combined efforts and shared commitment.
Ultimately, our efforts led to a full understanding of the issue and its resolution. Beyond fixing the immediate problem, we were also able to contribute to the Go community. We identified a debugging anomaly, initiated discussions for improvements to Go's runtime, and developed a proactive monitoring solution.

Elad Gavra
Author
Elad Gavra is a passionate computer programmer and Computer Science enthusiast. He enjoys working on distributed systems, cryptography, networking, and optimizations.
Elad currently serves as the Platform Team Lead at Cyolo. Follow him on Github.

Subscribe to Our Newsletter


3 More OT Remote Access Assumptions Worth Reconsidering
In a previous article, we examined four long-held assumptions about OT remote access that deserve to be revisited. This follow-up explores three more questions that are reshaping how industrial organizations think about secure remote access.

4 OT Remote Access Assumptions Worth Reconsidering
As OT remote access becomes increasingly essential to industrial operations, some long-standing assumptions about security, third-party vendor access, and legacy infrastructure deserve a second look.

How to Get IT Buy-In for OT-First Secure Remote Access
A practical guide for OT leaders seeking IT support for OT-first secure remote access. Learn how to address common objections, align with IT priorities, and build a stronger business case for industrial secure remote operations.